
Internet users, search engine developers, and large language models all agree: nobody likes a slow website. So there are many reasons to check your site regularly for sluggish load times, as issues can arise that a basic speed test can explain. That’s why it’s crucial to have advanced WordPress performance testing tools in place, so you are ready to respond when a critical need arises.
Why WordPress performance testing is critical
One of the biggest mistakes site owners can make is relying on just one tool for performance checks. Performance comes down to user experience, page structure, server resources, plugins, and traffic, and each one can cause a different kind of slowdown.
That's why it's worth using more than one tool to test your site. Here are the five site check tools we will go over in this article:
Google Site Kit shows how Google sees your site and how people behave once they arrive.
The EasyWP Stats menu shows how your hosting resources are being used.
Performance Lab lets you safely test newer front-end improvements module by module.
Query Monitor gives you a technical look at database queries, HTTP calls, hooks, and PHP behaviour.
Site Health highlights configuration issues and outdated components inside WordPress itself.
Put together, these tools give you something much more useful than a speed score. They help you find possible issues, test them, and make meaningful changes that improve performance.
Google Site Kit
Google Site Kit is Google’s official WordPress plugin for connecting Search Console, Analytics, PageSpeed Insights, and other Google services to your dashboard. Once installed, it displays dozens of essential site measurements right inside the WordPress dashboard. This means you can check performance each and every time you log into your website.
Understanding the speed dashboard in Site Kit
One of the most practical reasons to install Site Kit is its connection to PageSpeed Insights. That section gives you direct visibility into speed-related data without doing a manual check. When you find a page on your website that feels slow, you can get an immediate answer to what Google’s testing environment is reporting.
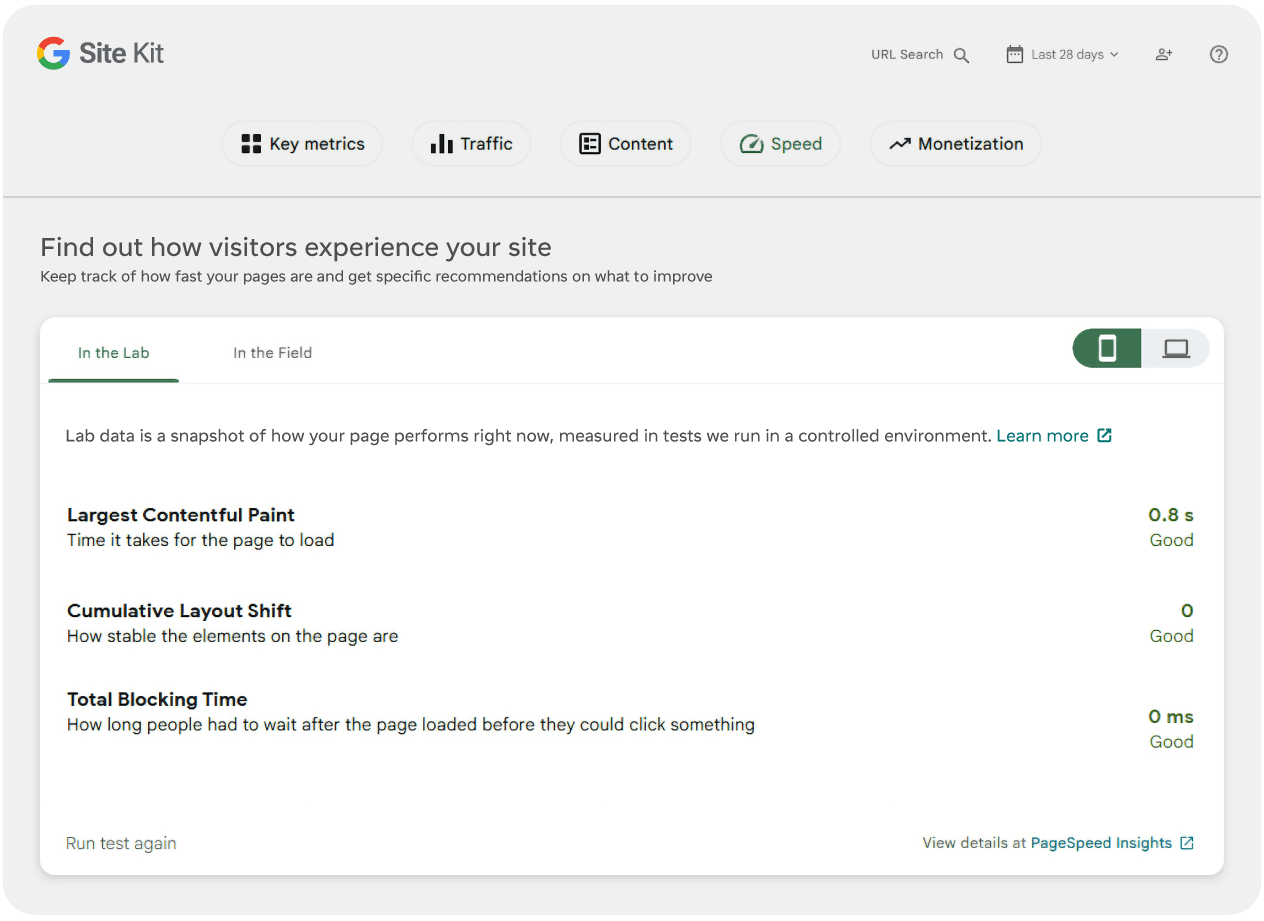
A weak score can be rooted in several different causes. It might mean your page has too much JavaScript, too many embeds, oversized images, or layout shifts that hurt user experience. In other words, the speed dashboard is best used as a clue, not a final diagnosis.
When you sense that your site or a particular page might be loading slowly, follow these steps:
Open Site Kit and review the scores under the speed tab, toggling to both mobile and desktop score, and taking screenshots for comparison later.
Click “Run test again” to get a current test score, compare that to your screenshot, and see if there are any differences.
Open PageSpeed Insights from the link to get deeper data points, if needed.
Compare the scores from all of the tests and look for patterns or any inconsistencies.
If all of your scores come up green, an indication of positive results, the slowdown could be related to your device or browser, rather than the website. Lower yellow and red scores mean it’s time to consider optimisations for your site.
While these speed scores are just the starting point, they are critical measurements, and can affect how often users see your site, especially via Google organic search results. Visit the Speed section of the Site Kit dashboard often, as low test scores here are one of the simplest ways to identify performance issues.
Use the traffic dashboard to detect other performance issues
Some performance issues can’t be detected in a speed test score. That’s why it’s important to pay attention to what real users do when they visit your site. Fortunately, Site Kit brings together Search Console and Analytics data so you can review traffic, page-level behaviour, and how people find and use your content from inside WordPress.
That means you can use traffic trends to infer logic about performance issues, even when a speed dashboard does not spell them out directly.
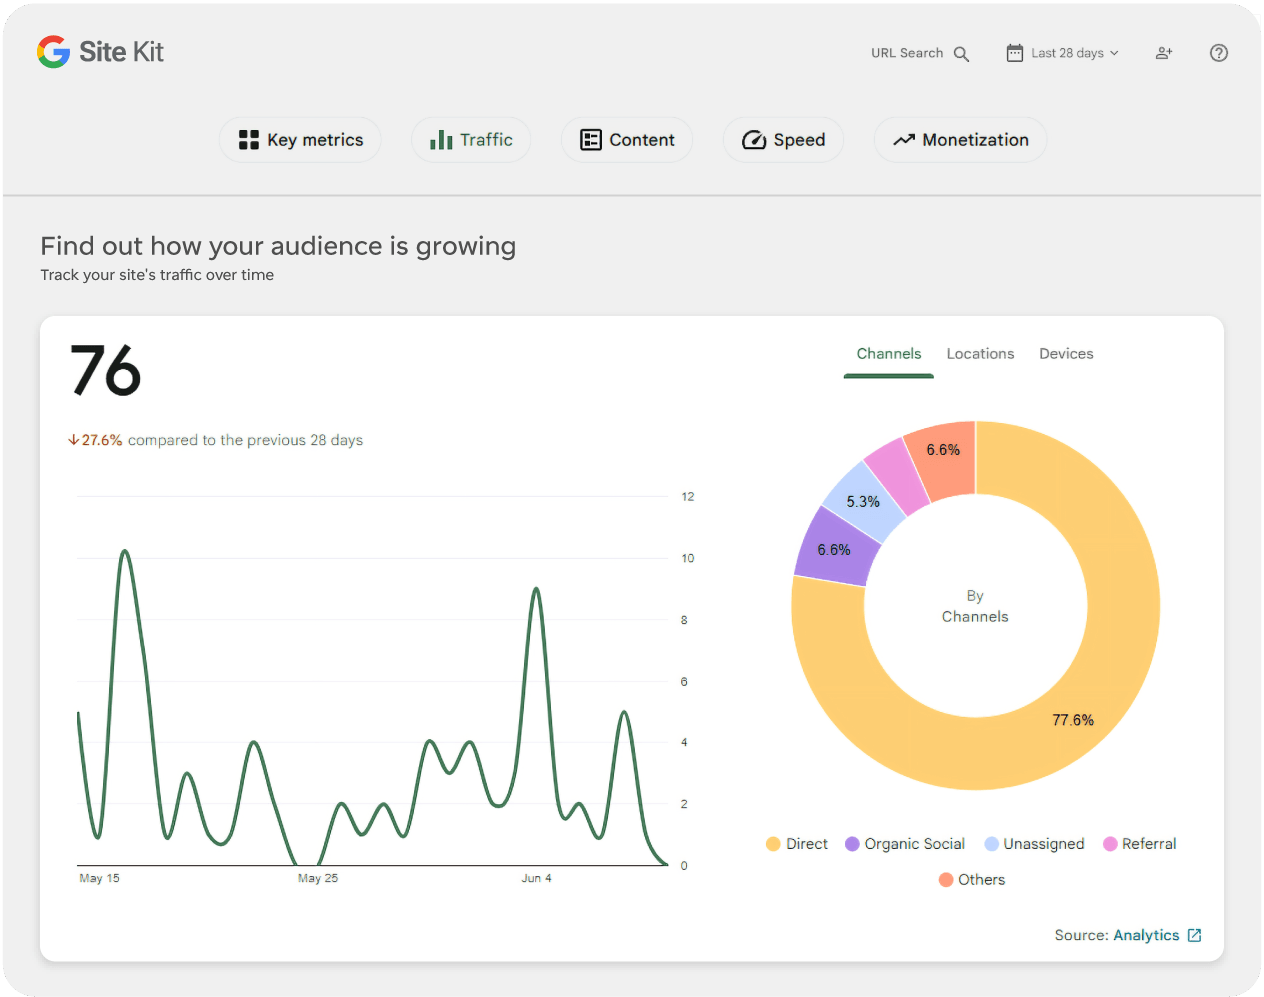
The Traffic section will give you aggregated information for your entire site, and you can toggle between channels, locations, and device-related data. Then you can click the Analytics link in the bottom right corner to see things in more detail. For example:
If mobile traffic is high but conversions are weak, that is a sign to compare mobile PageSpeed results and mobile layout behaviour more closely.
If one article gets far more new sessions than the rest of your site, that page deserves special performance attention because any slowdown there affects a larger share of visitors.
If organic traffic to one page is steady but engagement drops sharply after a redesign or theme migration, you may have introduced a UX or loading issue on that page.
This is not proof on its own, but it is strong directional evidence. Site Kit helps you spot which pages matter most and which audience segments may be experiencing the biggest friction.
EasyWP Stats
Once you have a theory from Site Kit, move to your EasyWP dashboard and open the Stats menu. EasyWP includes built-in tracking for visitor-focused metrics and Insights that help you understand the graphs and find opportunities for improvement.
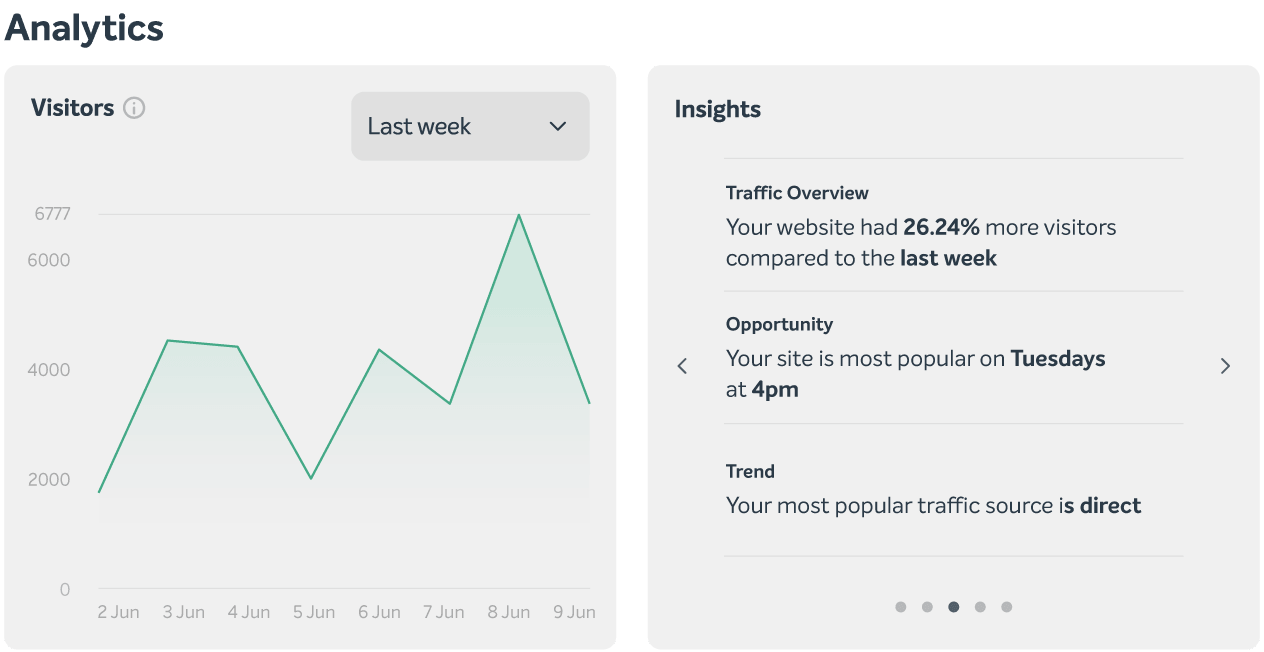
That matters because site slowdowns can be rooted in a variety of different issues. Sometimes the page is heavy because of front-end design choices. Other times, the underlying resources are being pushed too hard by traffic spikes, inefficient plugins, background jobs, or something else.
What to watch in the Performance section
The Stats area tracks CPU and RAM usage for you, and you can view bandwidth usage across the last 7 days.
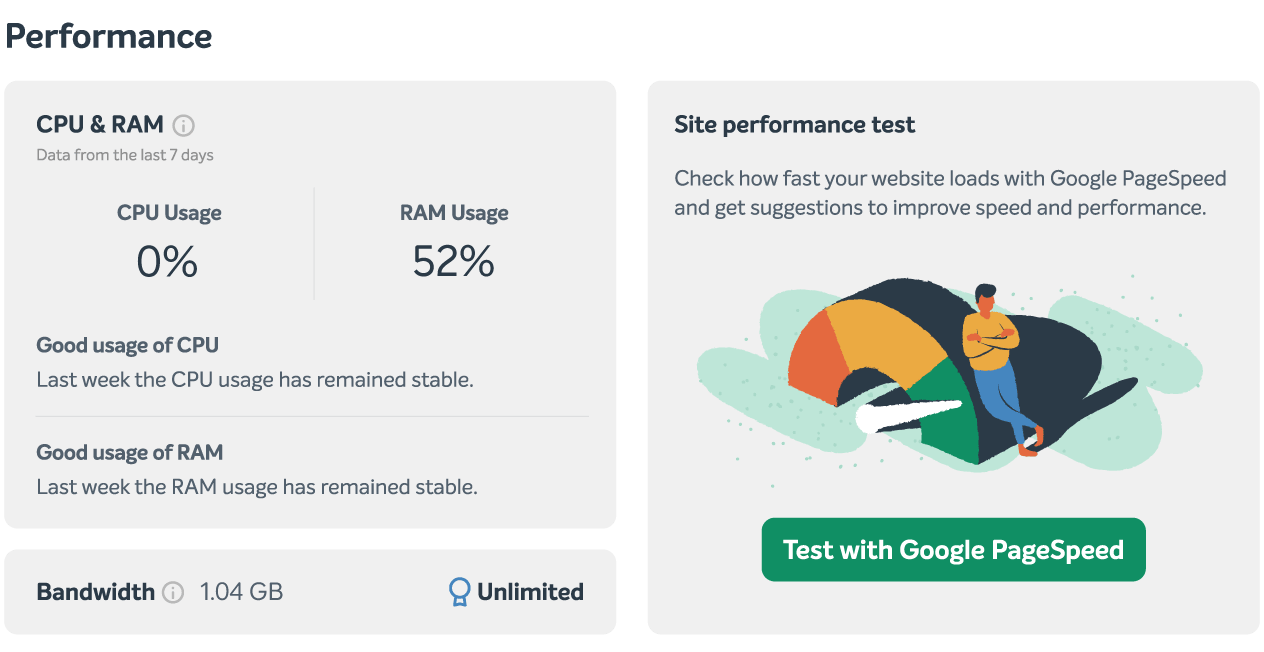
Temporary spikes can happen during routine software updates, site changes, or periods with more visitors than usual. That means the key is not to panic over one spike. The better thing to look for is whether spikes are frequent or exceed good usage levels for long periods of time.
Here are the most common causes when you see a spike in the Performance measurements:
Metric | What a sudden jump can mean | What to consider next |
|---|---|---|
CPU | More PHP work, a plugin process, more uncached requests, or higher traffic volume | Check whether you recently updated WordPress, changed plugins, or launched a campaign |
RAM | Heavier plugin activity, background processing, or memory-hungry page generation | Review recent plugin/theme changes and look for dynamic pages that bypass cache |
Bandwidth | More visitors, more bots, larger assets, or repeated delivery of heavy media | Check top pages, device patterns, and whether images or video assets are oversized |
When drastic changes really matter
Significant changes deserve attention when they line up with spikes reflected in the Stats menu. If you see this, ask these questions:
Did the spike happen right after a plugin, theme, or WordPress update?
Did it happen after publishing a new page with large images, embeds, or video?
Did it follow a traffic campaign, newsletter send, or sudden ranking boost?
Is the site actually slower for visitors, or is this only a chart anomaly?
This is where the EasyWP Stats menu becomes more than a dashboard. It becomes a way to separate a healthy site from a strained one.
Performance Lab
If Site Kit shows a page experience problem and EasyWP does not show a major resource issue, you are probably dealing with front-end optimisation. That is where the Performance Lab plugin becomes useful.
Performance Lab is a collection of performance-focused WordPress modules created by the WordPress team, many of which are intended to test improvements before they eventually move into core. Instead of forcing one big all-or-nothing switch, it lets you activate individual features and evaluate them on your site.
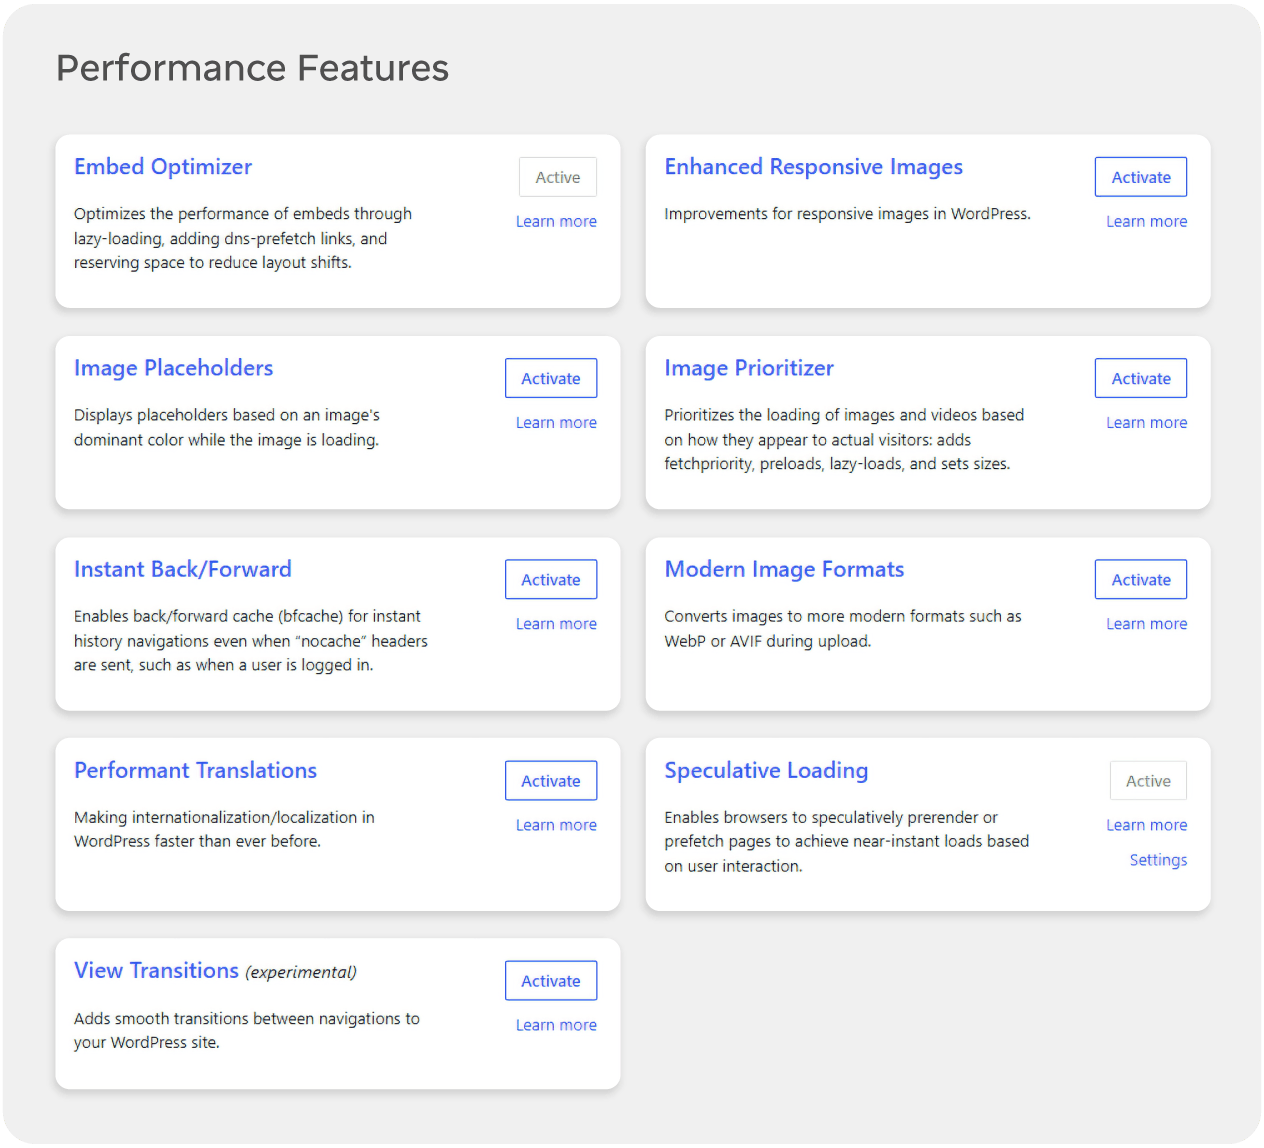
Start by looking at these modules
Currently, there are 9 different modules within the Performance Lab plugin, all of which can be activated separately depending on your site's needs. For most site owners, these are the modules worth understanding first.
Embed Optimizer
Use this to reduce the cost of embedded content, especially when pages rely on YouTube, social posts, or other third-party embeds. Activate it on pages that are heavy with embeds and feel sluggish or jumpy while loading. Skip it on pages with no or very few embeds, where it adds complexity without a clear benefit.
Image Placeholders
This adds lightweight placeholders so pages feel visually stable while images load, which can improve perceived performance and reduce layout jumps. Turn it on for image-heavy pages, especially on mobile, where blank spaces and layout shifts are common. It is less useful on text-first articles with very few images, where you may not notice much difference.
Speculative Loading
This uses the browser’s Speculation Rules API to prefetch or prerender likely next pages, which can make navigation feel almost instant. It works best on sites with clear browsing paths, such as blog archives, documentation, or stores where users often click from one internal page to the next. Be cautious on sites with highly dynamic flows, logged-in dashboards, or sensitive actions, where preloading extra URLs could create unnecessary work or unexpected side effects.
Modern Image Formats
This helps deliver newer image formats where supported, which can dramatically cut image weight on media-heavy pages. It is a strong candidate for sites that lean heavily on photography, featured images, or product galleries. Before turning it on everywhere, check how it interacts with your theme, CDN, and any existing image optimisation plugins, so you do not end up stacking overlapping tools.
Enhanced Responsive Images
This improves how image sizes are selected, which is useful for themes that do not always send the most efficient image size to each screen. It is worth enabling if you see mobile users downloading large desktop-sized images, or if PageSpeed reports flag inefficient image delivery. Avoid using it blindly alongside multiple other image-handling plugins without testing, because too many overlapping image optimisations can make troubleshooting harder instead of easier.
Query Monitor
Query Monitor is a developer tools panel for WordPress that exposes database queries, PHP errors, hooks and actions, HTTP API calls, scripts, styles, and related debugging information. It is excellent when you want to understand why a specific page load is expensive at the code level.
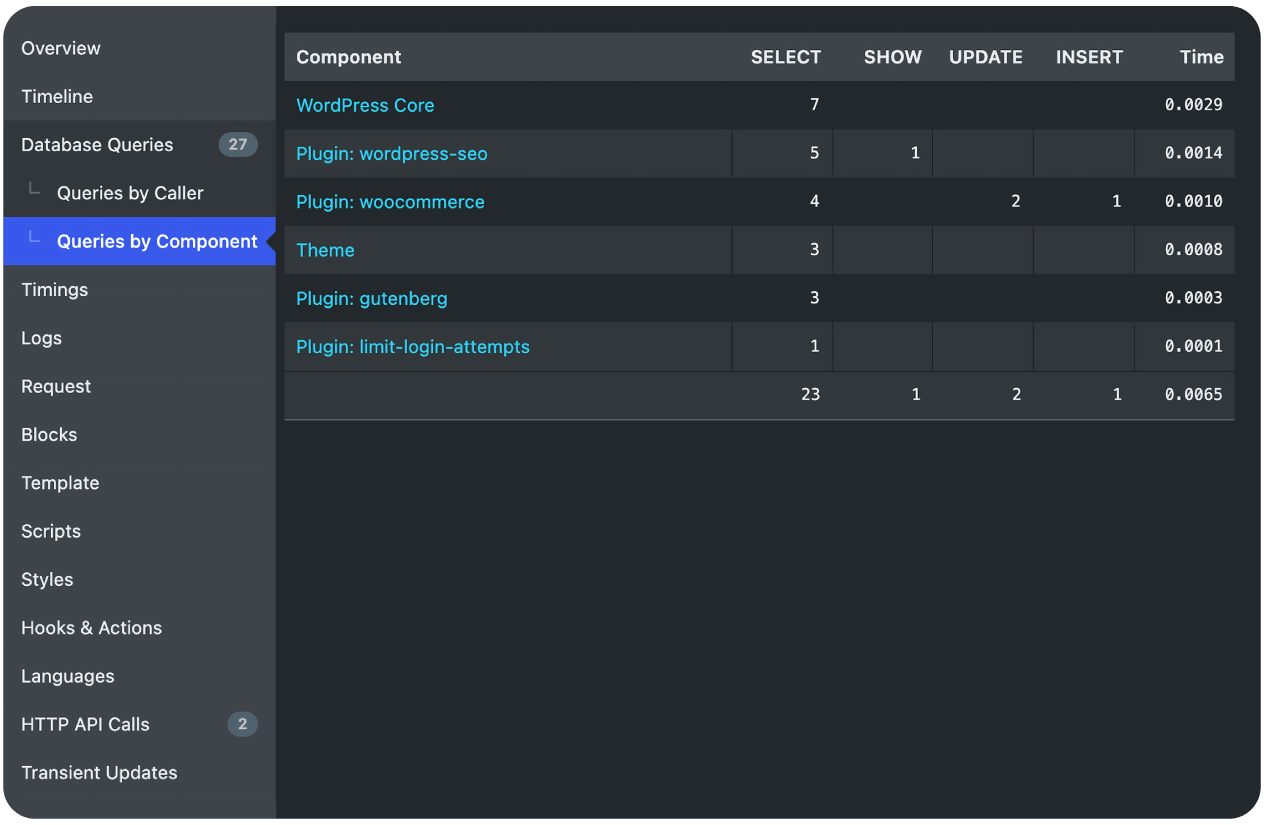
For site owners, the most useful data usually comes from four places:
The query panels, which show slow and duplicate database queries.
The component breakdown, which helps identify whether a plugin, theme, or core is responsible for those queries.
The HTTP API view, which shows external calls that may delay page generation.
The overview panel, which highlights page generation time and memory usage.
The reason to keep Query Monitor in a supporting role is that it answers a narrower question. It is not great for understanding broader visitor behaviour, long-term traffic patterns, or account-level resource pressure. It is great when you already suspect a particular plugin, template, or request path and want technical confirmation.
Site Health
There is one last simple tool to discuss today, and you can access it in a single click. Open Tools in your WordPress dashboard, and go to Site Health.
Site Health is built into WordPress and includes both a Status screen and an Info screen, giving you a quick view of whether your setup has obvious issues that could affect security, stability, and performance.
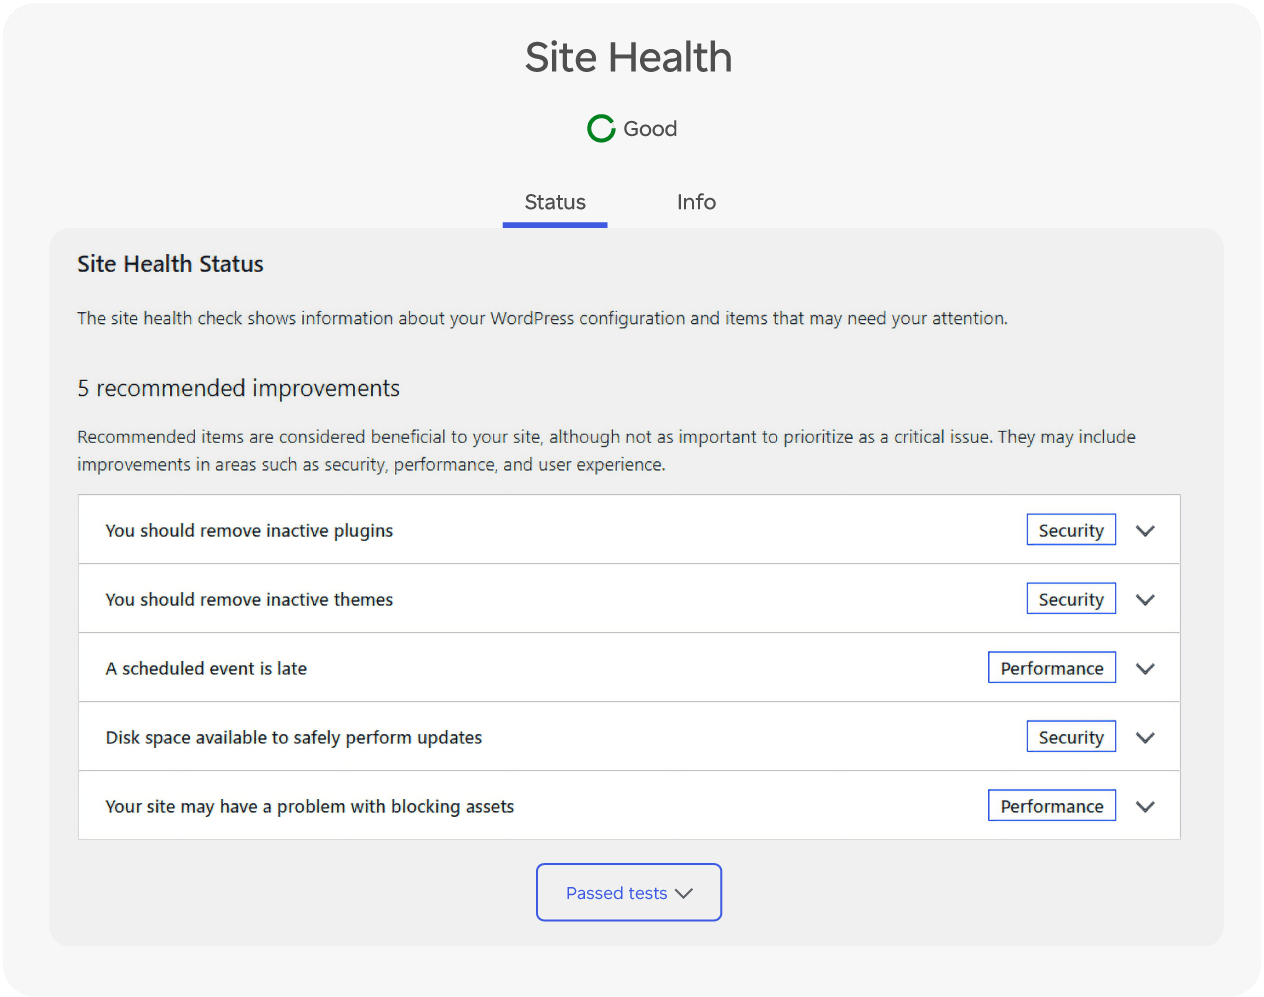
This matters because “advanced” performance work can be wasted if the basics are still broken. Site Health can point you towards outdated WordPress core, old PHP versions, debug mode issues, inactive but unnecessary plugins, scheduled task problems, and other configuration items that quietly drag performance down.
The Info tab is also useful when you need context. It gives you a snapshot of your WordPress version, server setup, active theme, active plugins, and other technical details that help explain the results you are seeing elsewhere.
In other words, Site Health is not where you solve every speed issue. It is where you confirm that your foundation does not undermine the rest of your testing.
Where the biggest gains usually come from

One of the most useful things advanced performance testing teaches you is that not every problem has the same solution. That is also why this multi-tool approach works so well. Google Site Kit helps you see how users and Google experience your site. EasyWP Stats shows what your hosting resources are doing underneath. Performance Lab helps you test modern optimisations safely. Query Monitor confirms code-level causes when needed. Site Health makes sure your fundamentals are still solid.
When you combine those views, WordPress performance stops being a mystery. It becomes a process of reading the right signals, making one useful change at a time, and focusing on the pages and behaviours that matter most to your visitors.
Frequently asked questions
Start by checking Google Site Kit’s speed scores for your most important pages, then compare those results with the Performance section in your EasyWP Stats menu. If scores are low and you also see repeated spikes in CPU, RAM, or bandwidth that line up with when the site feels slow, that is a strong sign you are dealing with a real performance issue rather than a local device issue.
Use Google Site Kit when you want to understand how Google sees your pages and how real visitors behave once they land on your site. Switch to EasyWP Stats when you want to see how your hosting resources are being used underneath that traffic, especially if you suspect traffic spikes, heavy plugins, or large media files are pushing CPU, RAM, or bandwidth harder than usual.
Both Performance Lab and Query Monitor are designed as diagnostic tools, but they still change how your site behaves, so you should use them carefully. Activate one Performance Lab module at a time, test a few pages, and use Query Monitor mainly on staging or during short investigation sessions, deactivating it again afterward so it does not add unnecessary overhead to your WordPress site.

Suggested articles




Share your thoughts