How to resolve resource overuse issues
All web hosting accounts have resource limits enforced by CloudLinux LVE (Lightweight Virtual Environment), a kernel-level technology built into the server. The limits ensure that all websites receive fair and equal access to their allocated share of resources.
These resources include CPU, physical memory, entry processes, and the number of active processes. You can find acceptable values for these resources as well as their soft and hard burst values in our Acceptable Use Policy.
When your account consistently reaches these limits, we call it resource overusage. This can lead to slower site performance, error messages, or timeouts on sites hosted on your account.
NOTE: If one domain on your hosting account exceeds the resource limit, all other domains hosted under the same account will also be affected, as they share the same resource pool.
This article helps you identify and fix resource overusage.
Checking your current resource usage
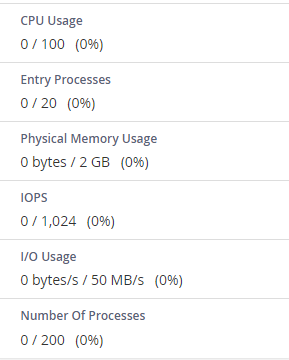
To check your hosting account resource usage in cPanel, look at the Statistics section displayed on the right:
NOTE: You’ll also receive notifications about hosting account resource limits within your Spaceship account. However, for more complete information, please refer to the "Hosting Usage" menu of your cPanel account.
And violations of our Acceptable Use Policy will be listed in the “Hosting Manager” menu > click “Manage” next to the hosting package in question > the Hosting usage section > the Reports log subsection.
Let’s break down the key resource metrics and how they affect your site's performance:
CPU usage
CPU usage shows how much of the allocated CPU power is being used at any given time. It’s shown as a percentage of your hosting account’s total capacity.
If the CPU usage reaches 100%, your account is consuming all its allocated resources. As a result, any new processes will be delayed (put to sleep) until existing ones finish. This can cause noticeable slowdowns, and in extreme cases, your site may time out.
Virtual memory usage
This refers to the amount of memory that processes can request within your LVE (Lightweight Virtual Environment).
When a process attempts to allocate memory, CloudLinux checks whether the total virtual memory usage remains within the set limit. If the limit is exceeded, new memory allocation is blocked, typically causing the process to fail.
Physical memory usage (RAM)
Physical memory represents the actual RAM assigned to your account. Unlike virtual memory (which often uses disk storage like swap files), physical memory handles active tasks in real time.
For example, publishing a large post may temporarily consume all available physical memory. While this may cause short-term slowdowns, usage usually returns to normal once the task is completed.
If your physical memory usage reaches its limit, you may encounter PHP errors on your website. In rare cases, a CloudLinux error page may appear. These issues are generally brief and are resolved automatically when usage drops below the threshold.
Entry processes
Entry processes represent the number of simultaneous processes entering your account. Each PHP or CGI script run by a user initiates an entry process. Although it’s often mistaken for "the number of visitors allowed", the processes typically run and complete so quickly that even with multiple users, you’re unlikely to reach the limit – unless your site receives a sudden spike in traffic.
Number of processes
This metric includes all processes generated by your account, not just PHP, SSH, or cron jobs. It’s a broader limit that reflects total activity.
Even under heavy usage, this number usually stays low because most non-PHP processes are short and finish quickly.
I/O usage (Input/Output)
I/O Usage measures how much disk activity your account generates. Any operation involving reading or writing data – such as backups or file uploads – counts towards this limit.
To ensure fair performance for all users, each account has a capped disk speed. If you hit this limit, your processes will still run, just more slowly.
In most cases, you won’t notice I/O usage unless you’re performing disk-intensive tasks, like generating a large site backup.
Defining active processes running on the account
If your hosting account reaches certain resource limits, the first step is to identify which processes are contributing to the overuse.
Via SSH
If the issue persists for more than a few minutes, you can review the active processes running in your account at the time of the spike using SSH:
Ensure SSH is enabled for your hosting account by checking the connection status in the “Manage shell” cPanel menu. If SSH is disabled, follow the steps in this article to activate it.
Navigate to the Terminal menu in your cPanel and run one of the following commands to identify the active processes in your account:
-ps faux
-top -c
You’ll then see a list of processes using most of your hosting account resources (CPU, virtual memory, etc.). The number of tasks, as well as their statuses (whether they’re active, sleeping, or stopped), will also be shown in the command output.
We would like to show you what the output of the “top -c” command looks like and provide instructions on how to understand it correctly: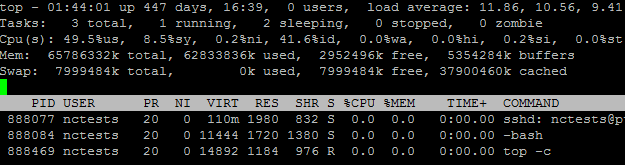
Here’s a simple guide on how to read this type of output:The first line – specifies the current time, time since the last boot, logged-in user session, and average system load (over the last minute, 5 and 15 minutes).
The second line – lists all the processes within a hosting account: running, sleeping, stopped, and zombie (the ones that were terminated but not properly removed).
The third line – provides information on how the CPU is used in %, where:
us = user processes
sy = system processes
ni = priority upgrade nice
wa = time waiting for I/O completion
hi = hardware interrupts
si = software interrupts
st = time stolen from the virtual machine by the hypervisor task
The fourth and fifth lines – indicate memory usage (RAM): total, used, free, and buffers.
The next rows provide details on the current processes:
PID – a process ID
USER – a cPanel user who is the process owner
PR – priority of the process
NI – a nice value of the process
VIRT – virtual memory used by the process
RES – physical memory used by the process
SHR – shared memory used by the process
S – status of the process (S – sleeping, D – uninterruptible sleep, R – running, T – stopped, Z – zombie)
%CPU – percentage of CPU used by this process
%MEM – percentage of physical memory used by this process
TIME+ – total CPU time used by the process
COMMAND – the process name
Before terminating any processes during a suspected hack, review the existing cron jobs in the Cron jobs menu of your cPanel account. If you find any suspicious entries or cron jobs you’re unsure about, it’s best to remove them to prevent potentially dangerous scripts from running.
Once you’ve identified a specific process that’s causing issues, you can terminate it by running thekill -9 PIDSSH command in the “Terminal” menu, where PID is the process ID from the previous step.
To terminate all processes except essential system ones, you can use the following command:ps aux | grep -v 'bin/bash' | awk '{ print $2 }' | grep -v PID | xargs kill -9Next, identify which MySQL processes are currently running.
You can check all MySQL processes for your cPanel account (1) or check them by MySQL user (2).
To do so, open the Terminal in your cPanel and run one of the following commands:
To check the MySQL processes for the entire hosting account:mysql -u $CPANEL_USER -p -e "SHOW PROCESSLIST;"
To check the MySQL processes for a MySQL user:mysql -u $MYSQL_USER -p -e "SHOW PROCESSLIST;"
Be sure to replace “CPANEL_USER” with your cPanel username to check the processes for a hosting account (1) and “$MYSQL_USER” with the specific MySQL database username to check them for each individual MySQL user (2).
Then, enter a cPanel account password (1) or the password for the specific database user (2):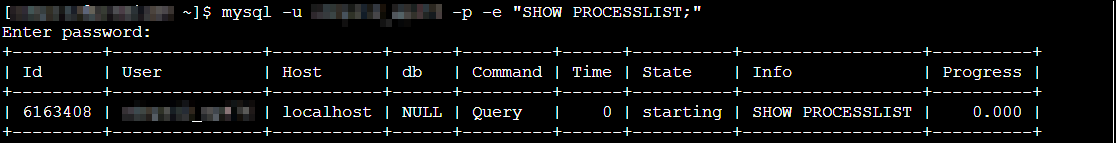
The last step is terminating MySQL processes for a particular database user. This can only be performed by our Support team. Feel free to contact us and we’ll be happy to help you.
Via the “Resource usage” menu
If the issue lasts only a few seconds, it may be difficult to identify the processes that are causing it, as data isn’t logged for such short periods.
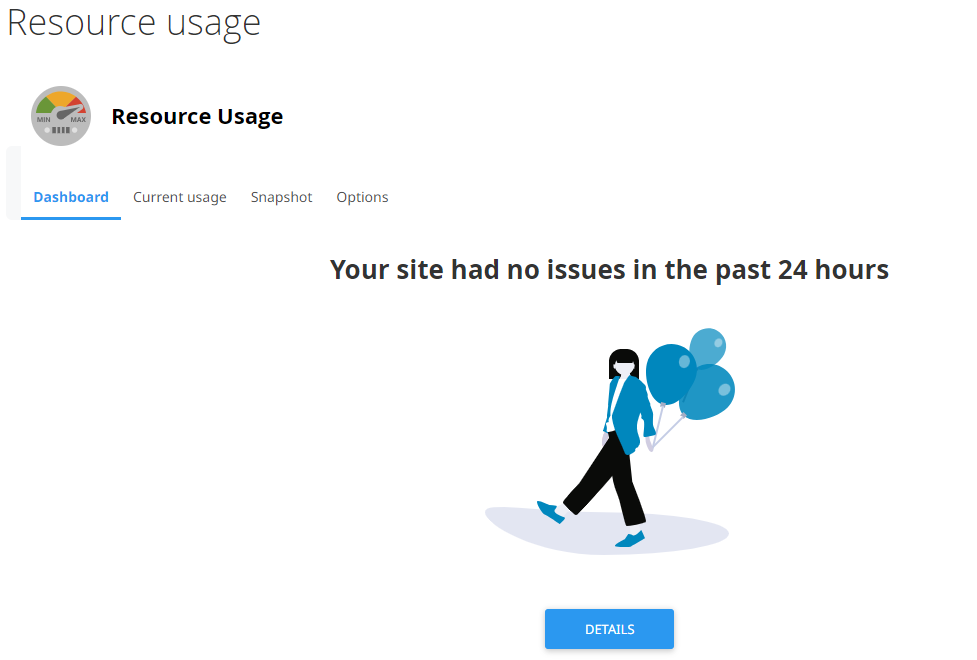
But you can always check the Resource Usage menu in cPanel to check historical trends. This can help you identify patterns or determine which resources are approaching their limits:
A message about the frequently hit resources will be shown right after opening the menu > under its “Dashboard” section with a reference to the exact limits:
Under the Current usage section of the menu, use the Timeframe drop-down to choose a period and check how the account resources were used during this time:
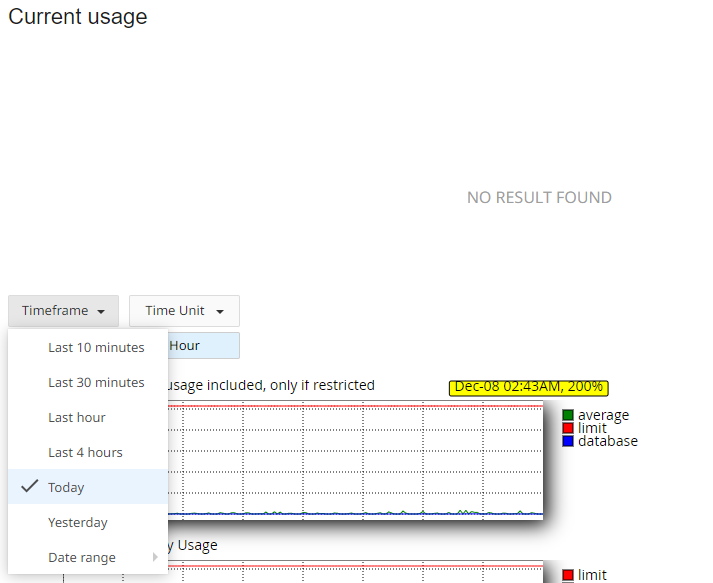
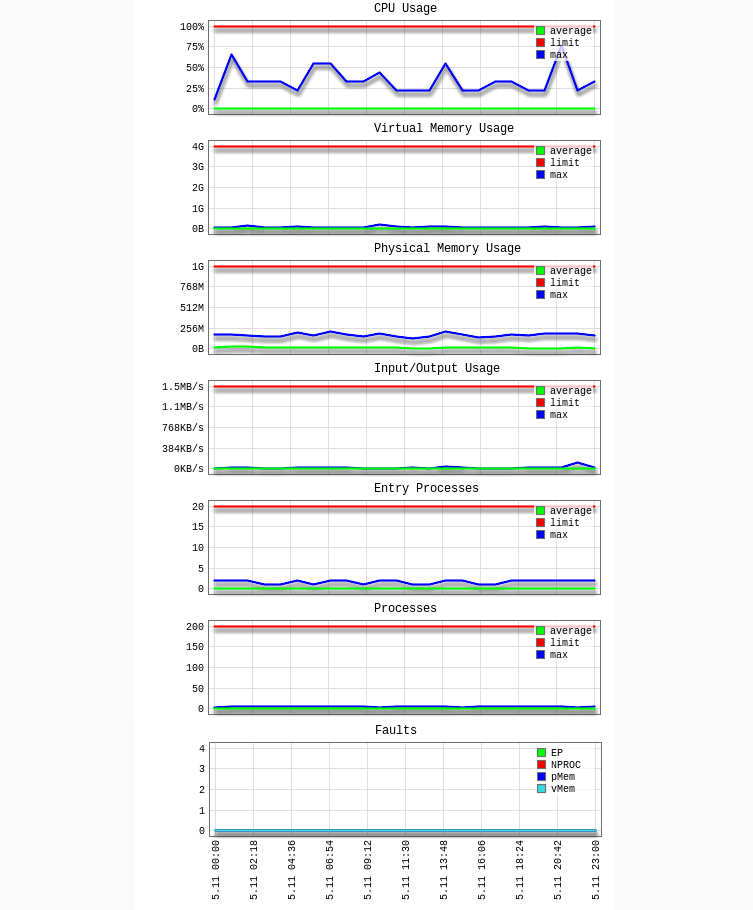
Once selected, you’ll see diagrams and tables showing detailed statistics:
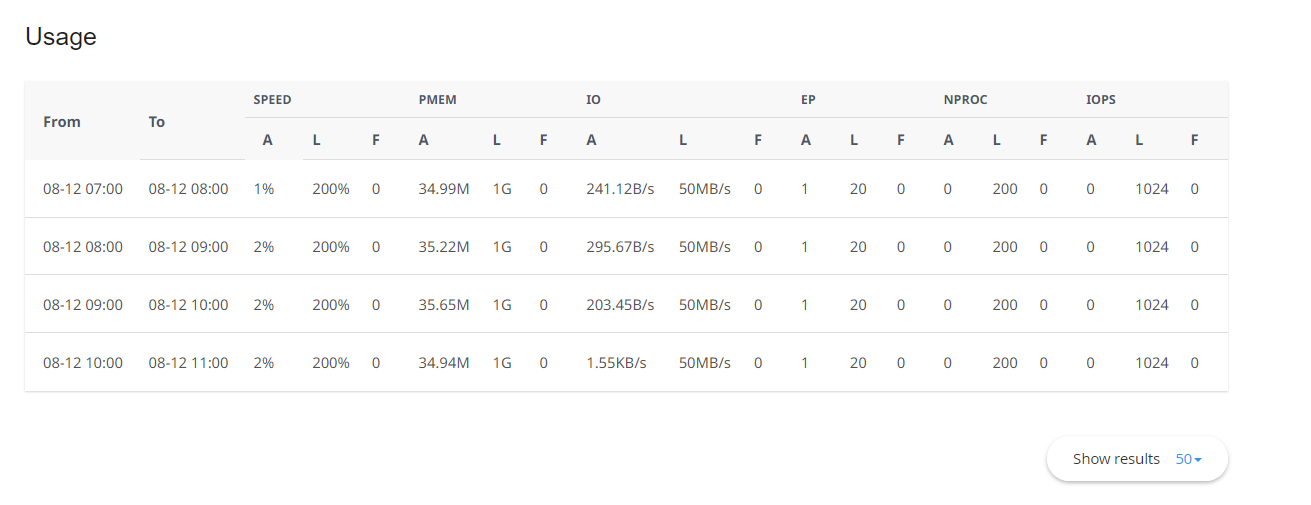
Here's a simple guide to the values listed in the table above:
CPU – CPU limit
vMEM/vM – Virtual Memory limits
pMEM/pM – Physical Memory limits
EP – Entry Processes
nPROC/nP – Number of Processes
IO – Input/Output limits
A – average used
L – limit set for account
F – failure
Potential issues when terminating active processes in cPanel
Stopping active processes in cPanel may help address performance issues, but tread carefully – it may create new problems. Below are some key areas to keep in mind:
Data integrity: Forcefully terminating a process can compromise data integrity. Especially if this process involves writing or updating data in the account. It’s best to check the process isn’t tied to critical database operations before terminating it.
Incomplete transactions: Stopping a process mid-operation may leave transactions unfinished, and cause issues with database states. In extreme cases, this could result in data corruption or loss.
Service disruption: Some processes, such as MySQL-related processes, are extremely important for core services. Terminating them can cause temporary service outages and impact your website’s functionality.
Unsaved changes: If a process managing configurations or settings is terminated before changes are saved, it may affect how features or applications behave.
Resource allocation: While terminating processes can free up system resources, it doesn’t solve the underlying causes behind high usage. To prevent the issue from repeating, a deeper analysis is needed.
Application stability: Interrupting processes tied to web apps can make them unstable. It’s important to understand how processes work before taking action.
Logging and monitoring: Some processes are involved in logging or system monitoring. Terminating them may interrupt these functions, so make sure critical logs and monitoring tools remain operational.
In critical situations (e.g., during resource overuse or suspected malicious activity), ending processes may be necessary despite the risks. But always weigh the potential impact before taking action.
Best practices to reduce the risk of process termination
Back up your data: Always create a backup before making major changes, particularly when working with databases.
Use controlled shutdowns when possible: Try to shut down processes gradually to reduce the risk of data loss or corruption.
Disable malicious components: If you suspect a specific part of your website (e.g., a plugin or theme) is generating malicious processes, disable it right away to prevent further harm. If unsure, check any suspicious activity with a specialist.
Use maintenance mode: Temporarily placing your site in maintenance mode can help determine whether certain processes are being automatically recreated.
Monitor closely: After terminating any processes, carefully observe the system’s behaviour and be ready to troubleshoot unexpected issues.
How to reduce resource usage after identifying the problematic process
Once you've pinpointed which processes are causing your account to hit resource limits, try these common ways to reduce usage:
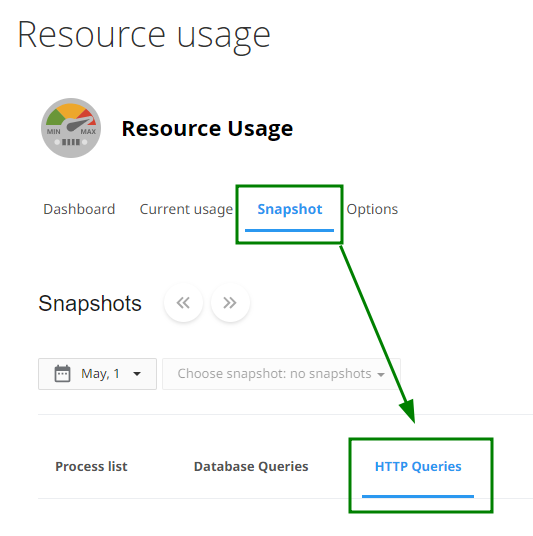
Traffic spikes: To see when your account had too many active processes, open the Resource usage menu > Snapshots > HTTP queries tab:
If you see in the output that there are a lot of requests, e.g. to the index.php page, this may be caused by high traffic to the website (e.g., by visitors or bots).
Check the Awstats and Visitors menus in cPanel for detailed visitor analytics to locate the exact reason. A sudden increase in traffic might be the reason behind higher resource usage. If your visitor numbers are steadily growing and you're still experiencing limitations, it may be time to review and upgrade your current hosting plan.
The Statistics section of the Awstats menu can help you identify the source of the high CPU. You can find this by clicking the “View” button opposite the domain name: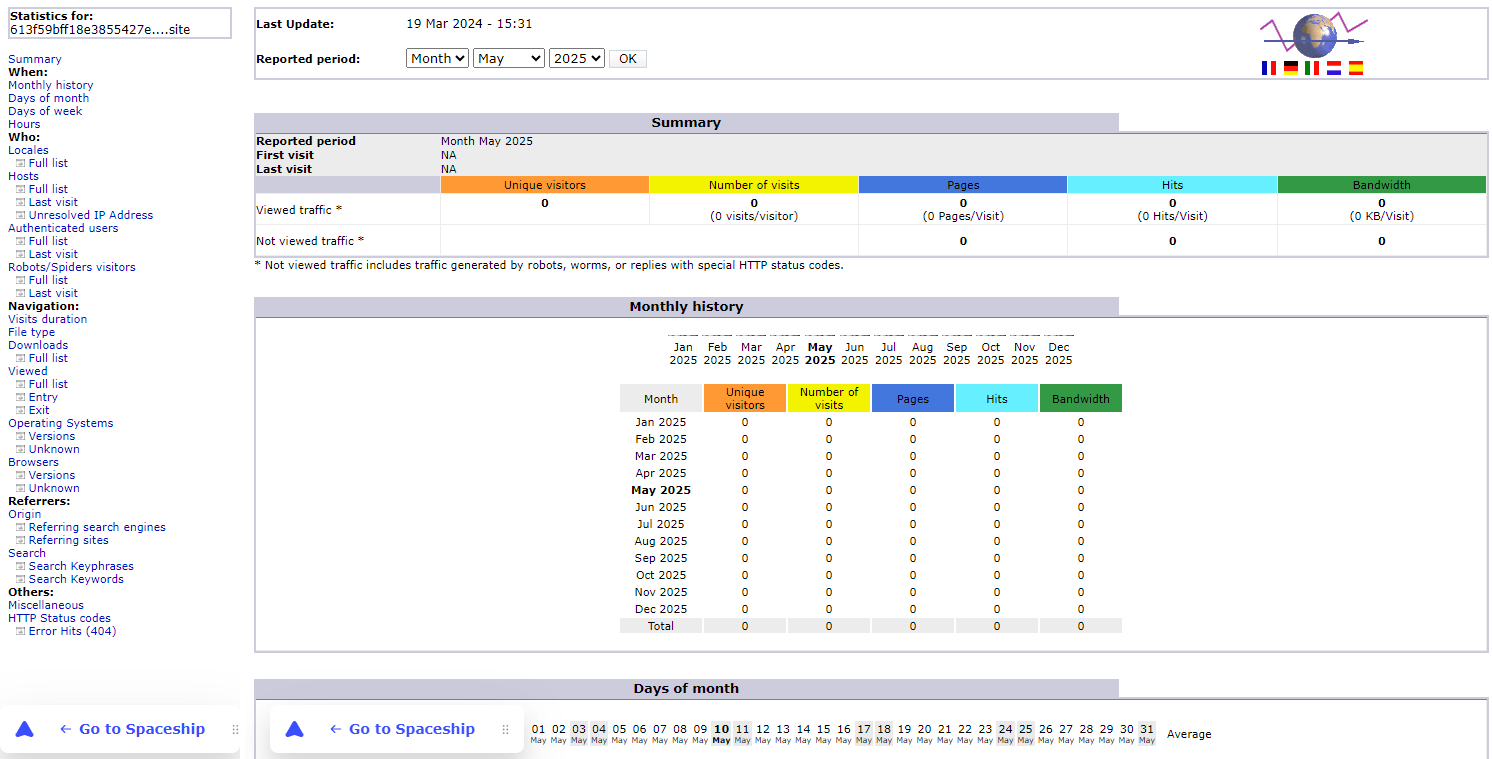
NOTE: Keep in mind that the data in the Awstats menu is not updated in real time, and only monthly statistics are available. Be sure to check when the statistics data was updated to make sure the information is related to your case. You’ll find this information in the “Last Update” line.
Once accessed, you will see detailed stats on how much bandwidth specific elements of the website are consuming, including:Unknown bots: If such traffic is not expected, the bots can be blocked via the robots.txt file, rate-limited (e.g. for Googlebot), or hard-blocked via the .htaccess file and User-Agent string.
NOTE: These changes can affect the website’s SEO. If you’re not sure whether you want to proceed, it is better to consult with an SEO specialist.Images: If there are a lot of requests to one image, it could mean there is a DDoS or a self-DoS attack on this image.
Pages: A website page or a product placed on it can also be affected by a DDoS attack.
files.
Downloaded files, etc.
Recent website changes: If this is your first time encountering resource usage issues, review any recent updates or changes made to your website. These could be contributing to the increased load.
New plugins or themes: If you’ve recently installed a new plugin or theme, try disabling it and monitor your site’s performance for at least 10 minutes.
You can also find slow-loading plugins in the GTmetrix report > the Waterfall tab.
NOTE: Changes may not take effect immediately. We recommend monitoring your website’s behaviour for up to an hour for accurate results.
Website optimisation: Optimise your website’s performance using tools like Google PageSpeed Insights.
In addition, the following plugins will help you monitor the resource usage and overall performance of the website – which is extremely helpful when locating the website’s internal bottlenecks:
If you’re still encountering resource issues, please reach out to our Support Team via Live Chat or email. We’re here to help you identify and resolve any problems.